Thursday, October 31, 2019
Blog Day Thirty: 200 Years of Progression of The World
Today in class we watched a video about the relationship between a country's lifespan and the country's GDP per capita. Hans Rosling showed us this data of 200 years in four minutes. In this video Rosling was trying to animate the data he collected in real space. To start in 1810 almost every country was in the bottom left corner of the graph, the lowest life span and smallest GDP per capita. At the time the UK and the Netherlands were at the top with the highest life span and GDP per capita. This mainly because the Industrial Revolution started to develop in these countries. As the graph started to go past the next few years you saw that the African and Asian nations are still stuck in the same corner all the other countries started in. This is because these countries were not involved in the Industrial Revolution. Moving forwards a few years, you saw many nations drop because of the Spanish Flu Epidemic and the First World War. Around 1930 China and India are still some of the poorest countries with the lowest life expectancy and the biggest population. Coming up to the most recent times, when the video was made, in 2009 almost every country has moved out of the poor and sick section of the graph. Rosling thinks that eventually all countries will be able to reach the top corner because of aid, trade, green technology, and peace. I really enjoyed watching this video. It was cool to see all the data progress on the graph. And since today is the 31st, HAPPY HALLOWEEN!
Wednesday, October 30, 2019
Blog Day Twenty- Nine: Population Pyramids
Today in class we finished going over the test. We also started to watch a video about population pyramids. In the video I learned that Russia and Nigeria have the same population, only Nigeria is one- sixteenth the size of Russia. Then the video started to discuss population pyramids. I learned that the pyramids are split in half based on gender, and that males are on the left where females are on the right side of the pyramid. The pyramid is also split in five-year increments. With those five year increments the entire chart is split into three different groups. The first at the bottom of the pyramid being pre-reproductive, which runs from ages zero to fourteen. The next group on the middle of the pyramid is the reproductive group, which runs from ages fifteen to forty-four. The last age group at the top of the pyramid is the post reproductive age group, which runs ages forty- five and up. Overall population pyramids are a cool way to track a country's population and I look forward to finishing the video tomorrow.
Monday, October 28, 2019
Blog Day Twenty- Eight: Reviewing Test and Population Pyramids
Today in class we went over the test we took on Friday. I was very happy with my grade. I feel like I was more prepared for this test and I am happy to end the quarter with my test grade. Even though I did get a good grade I think I could have studied even more to get an even better grade. After looking over the test I saw that I did get the question that I was unsure about wrong. But that is okay because you can't get them all right all the time. Also in class we started to independently learn about population pyramids. Some things I found interesting about this way of measuring population is that it is split between male and female. The pyramid is also split by age groups. 0-14 is prereproductive,15-44 is reproductive, and 45- 100+ is post reproductive. Today was a good class, especially because it was an early dismissal day.
Friday, October 25, 2019
Blog Day Twenty- Seven: Test Number Three
Today in class we had our third test. I felt much more prepared for this test. I also felt as though I studied more thoroughly for this test. I liked the format of this test. I liked that we were tested on using the CIA World Factbook because is was pretty easy to navigate once you got the hang of using the database. So far I would say that this has probably been the easiest test we have had this year. Even though I thought it was easy I do think that I may have messed up on one or two of the questions. To improve for the next test I think I just need to look over the PowerPoint and my notes even more than I did this time. I feel like I did well on this test because the unit wasn't very long. Since the unit wasn't long I didn't have to remember things that we may have learned more than two weeks ago. I am excited for the next unit and I hope it will be just as fun to learn about as this unit was.
Thursday, October 24, 2019
Blog Day Twenty- Six: Test Day Tomorrow
Today in class we went over questions for the test we have on Friday, tomorrow. It was very nice to have a review and now I know what to study, for the test. Tonight to study I plan on reviewing how to use the CIA world factbook in order to find and answer the questions on tomorrow test more efficiently and in the given time amount. I also plan on looking over my notes, that we took in class for the past few days, multiple times and making sure I know everything that I starred during class today. Finally, I plan on planning out some of the answers that I know will be on tomorrow's test. In order to do that I have to look for push and pull factors that different countries have. Over all I really liked having this review day as I think it will really help in my efforts to get a good grade on this test.
Tuesday, October 22, 2019
Blog Day Twenty-Five: Reviewing Questions
Today in class we discussed answers to the questions we completed in yesterday's blog. I found it very interesting that both India and China their population is almost greater than the United States by one billion people. The crazy part is that the area of each country is very similar and what is even more interesting is that the United States is almost three times bigger than India. That means that the people in India are more crowded than the people in the United States because India has more people but less land. I also found it interesting that only 76.2% of the United States populations has and uses electricity. That means that about one fourth of our population in the United States does not have access to electricity. I found this so shocking because our society is advanced compare to the rest of the world and having about 25% of our population not having electricity makes me think we are not as advanced as we could be.
Monday, October 21, 2019
Blog Day Twenty Four: Answering Questions with the World Factbook
Today in Class we answered the Following Questions.
- What is the population of China, and of India?The population of China is 1,384,688,986 and the population of India is 1,296,834,042.
- What is the Total Fertility Rate in Japan?
The TFR in Japan is 1.42 children/ woman
- What is the death rate in El Salvador?The death rate is 5.8 deaths/1,000 population.
- What percentage of the French identify “none” as their religion? Is this statistic verifiable, and why?23-28% Is the percentage of French that identify their religion as none. This statistic is not verifiable because the last census was took in 1872 and it has not been taken since.
- What percentage of Mexicans identify themselves as Roman Catholic?82.7 % of mexicans identify themselves as Roman Catholics.
- What is the GDP - per capita (PPP) in the United States?$59,800 is the United States GDP per capita.
- What is the GDP - per capita (PPP) in Nigeria?$5,900 is Nigeria's GDP per capita.
- What is the GDP - per capita (PPP) in Luxembourg?$105,100 is Luxembourg's GDP per capita.
- What percentage of the United States’ population are Internet users?76.2% of the United States population uses the Internet.
- What is the number of airports in Russia, and in the United States?There are 1,218 airports on Russia.
- How many people in the world do not have electricity?
1.201 Billion people don't have electricity.
- What is the Infant Mortality Rate in Canada, Cuba, and the United States?The IMR for Canada is 4.5 deaths/ 1000 live births, for Cuba is 4.4 deaths/ 1000 live births, United States is 5.7 deaths/ 1000 live births.
- What is the literacy rate - total, for men, and for women - in Afghanistan?The total literacy rate is 38.2% for the total population, 52% for males, 24.2% for females.
- What three countries have the highest life expectancy?Monaco, Japan, and Singapore have the highest life expectancy.
- What three countries have the lowest life expectancy?Lesotho, Zambia, Afghanistan have the lowest life expectancy.
- What nation has the sixteenth highest Net Migration Rate?Monaco has the sixteenth highest NMR.
- What is the unemployment rate in Vietnam, South Korea, the United States, India and Kenya?The Unemployment rate in Vietnam is 2.2%, in South Korea is 3.7%, in the United States is 4.4%, in India is 8.5 %, in Kenya is 40%.
- Military Expenditures are listed by the percentage of each nation's GDP spent on defense.
What percentage is spent by Germany, China, and the United States?
Germany is 1.24% GDP, China is 1.87% GDP, the United States is 3.16%
Germany is 1.24% GDP, China is 1.87% GDP, the United States is 3.16%
19. What three countries produce the most crude oil, and how much do they produce?
The United States produces 10,692,000 BBL/ day, Russia produces 10,759,000 BBL/ day, Saudi Arabia produces 10,425,000 BBL/ day.
The United States produces 10,692,000 BBL/ day, Russia produces 10,759,000 BBL/ day, Saudi Arabia produces 10,425,000 BBL/ day.
20. What three countries import the most crude oil, and how much do they import?
The united States imports 7,969,000 BBL/ day, China imports 6,710,000 BBL/ day, India imports 4,057,000 BBL/ day.
The united States imports 7,969,000 BBL/ day, China imports 6,710,000 BBL/ day, India imports 4,057,000 BBL/ day.
21. What percentage of the world’s people speak Spanish? Chinese? English?
12.3% speak Chinese, 6% speak Spanish, 5.1% speak English.
12.3% speak Chinese, 6% speak Spanish, 5.1% speak English.
Friday, October 18, 2019
Blog Day Twenty-Three: NMR, RNI, and Push/ Pull Factors
Today in class we talked about push and pull factors, net migration rate, and the rate of natural increase. Push factors are things that happen in your country that are so bad that they drive you out of your own country. Pull factors are positive things that attract you away from your home country to another country. Net migration rate can be found as either a positive or negative number. If it's found as a positive number then it is an immigration rate. If it's found as a negative number then it is a emigration rate. The difference is that an immigrant is someone who is coming into a country other than their home country. An emigrant is someone who is exiting or leaving their home country. The rate of natural increase is the annual growth rate of the population. This rate is found by subtracting the death rate from the birth rate. Today's class was fun and I am really enjoying this unit so far.
Tuesday, October 15, 2019
Blog Day Twenty-Two: Life Expectancy
Today in class we talked about life expectancy. Life expectancy is defined as the average number of years to be lived by a group of people born in the same year. America is ranked number 42 in the world for the length of our populations life expectancy. The average American life expectancy is 79.68 years. The average male life expectancy in the USA is 77.32 years, whereas the average female life expectancy is 81.97 years. The highest average life expectancy in the world is held by the country Morocco. The average amount of years is 89.52 years. The average male life expectancy is 85.93 years whereas the average life expectancy for females is 93.58 years in Morocco. In class we also talked about whether Mr. Schick's generation's life expectancy would be longer than our generation's life expectancy. Many good points were brought up. Someone mentioned that our medicine now is much more advanced and developed than the medicine used when Mr. Schick was a kid. Another support to the student's generation is that we also now know the effect of cigarettes, tobacco, and nicotine to humans. To counter that argument there are a lot of things in the students generations that would not have happened in Mr. schick's generation or even be researched yet. For example Mr. Schick's generations never had a opioid epidemic, whereas we are growing up with signs outside of every police station reminding us of how many people have had an overdose and/ or died from it. Also Mr. Schick generations never had vapes and juuls. There is plenty of advertisement to us kids to get us hooked at an early age where most of us know there is little research does on this very harmful nicotine device. In the end, only time will tell who's generation lives longer. P.S. I really like this unit so far!
Saturday, October 12, 2019
Blog Day Twenty-One: Population and Settlement
Today in class we started to take notes on Population and settlement. Here are some notes I took:
- 7.6 billion people live on the planet
- 2.5 people are born every second
- 149 people are born every minute
- 8377 are born every hour
- 200,00 are born everyday
- 90% of this reproduction takes place in developing countries such as Africa, South and East Asia, and Latin America
We also talked about how sad some of the information in this unit will be. For example when we looked at the world population we saw that one person dies every 11 seconds, which is very sad when you think about it. I am excited to start our new. It seems like there will be lots of interesting, fun and maybe even sometimes sad information that we will learn about.
Thursday, October 10, 2019
Blog Day Twenty: Reviewing Test Two
Today in class we got back our tests and reviewed them. I thought that most of the test was fair and I am happy that Mr. Schick is curving the tests for the two questions that a lot of people got wrong. I feel like for the next test it would be nice to have more warning and be told about the test out loud rather than it be one the blog a few days before the tests. I feel like I would have been able to study more if I was given more time in between when Mr. schick announced the test and when we were supposed to take the test, my score could have been higher. I do realize that I could have spent more time studying so I am not made with my grade as I feel it was a fair score to the amount of time I spent studying. For the next test I hope to study more and take better notes on all the PowerPoint slides we discuss.
Tuesday, October 8, 2019
Blog Day Nineteen: Test Two
Today in class we had a test. Test two of the course! I think I did okay considering I had a late night last night with not a lot of time to study. In future tests it would be nice to know a few days ahead of time that we have a test coming up. This time Mr. Schick didn't tell us until a day before the test itself. I know it is posted on his blog but many people, myself included, don't check his blog every day. Usually teachers always tell us to start studying a few days before the test that way we can absorb the information, but if we don't learn about the test until a day before we won't have as much time to absorb and remember the information we learn in the beginning of the unit. Back to the test. I thought I did well, not my best though. I was very happy to learn today that I got a ten out of ten on the pop quiz so hopefully I do just as well on the test itself. Overall it was a challenging test and I hope I did well.
Monday, October 7, 2019
Blog Day Eighteen: A Pop Quiz?!
Today in class we had what every student dreads. A pop quiz. I do not think I did too poorly on this quiz, at least I hope I didn't. It was a nice preparation for the test we have tomorrow. Thankfully I guessed correctly that longitude it the one that runs up and down and latitude is the one the one that is parallel and runs side to side. I had a fifty-fifty shot and for once I guessed correctly. We also finished are discussion on Time Zones. In the end, as I said in the last blog, I ended up choosing the side to keep time zones. I am glad we had this debate and I am glad that Mr. Schick thought we handled it like adults. I hope that I do well on this test. There is one side of me that likes that fact that we don't have to write an essay but, there is another side of me that really doesn't like Scantron Sheets. Other than the pop quiz, today was a good class.
Friday, October 4, 2019
Blog Day Seventeen: The Time Zone Discussion
Today in class we had a discussion about Time Zones. As I said in my blog before this, I was on the undecided side. By the end of the discussion I think I am leaning more towards keeping Time Zones. Although I do see reasons to get rid of time zones, I do think keeping them is the better option. I also picked this side because more practical reasoning was presented during the discussion. I personally think that no matter what happens with the time zones, the position of the sun to the Earth will always be the same. You can't change the position of the sun and when you change the time zones it will not change the fact that it will be day somewhere and night somewhere else. Also it would be extremely hard to change the entire time zone system. If the United Nations even wanted to change the time zone not all countries on the Earth would want to as well. There is no rules to time so really any country can do whatever they want. The system right now is confusing but, it has work for the past 200 or more years. That is why I have picked to now be on the keeping time zones side of the argument.
Wednesday, October 2, 2019
Blog Day Sixteen: Preparation for Time Zone Discussion
Today in class we started to research for a discussion we are having in Friday's class. The topic was time zones and if we should keep them or not. There were three different points of view that the class could take. You could be for keeping the time zones the way they are now, against the time zones and wanting to abolish them, or you could right in the middle and not really have a solid opinion on what we should do with the times zones. I chose to be in the group that didn't yet have a say in the matter. I am quite intrigued to see what the two opposing sides say on Friday. I am not really leaning towards any specific side because I can personally see reason to keep and get rid of time zones. Our undecided group did have to take notes on both sides that way we have a fair view and knowledge of each opposing group. On thing that I remember typing was that time zones are not all consistent. Some are off by the half hour and others by the hour and, since time zones aren't a huge deal compared to everything else going on in the world right now, there isn't any law saying how they should work. Some time zones are not even in the same rate as the sun, meaning it can be seven o'clock and dark somewhere where it could also be seven o'clock and light somewhere else. I am looking forward to seeing and hearing counter arguments and the discussion bright and early on Friday morning.
Tuesday, October 1, 2019
Blog Day Fifteen: Time Zones
Today in class we started to learn about Time Zones! Before today, I do not think I have ever seen the real time zone map with how all the timing works. The map is very confusing. All though some parts of the division of the map makes sense, the overall look of the map is confusing.
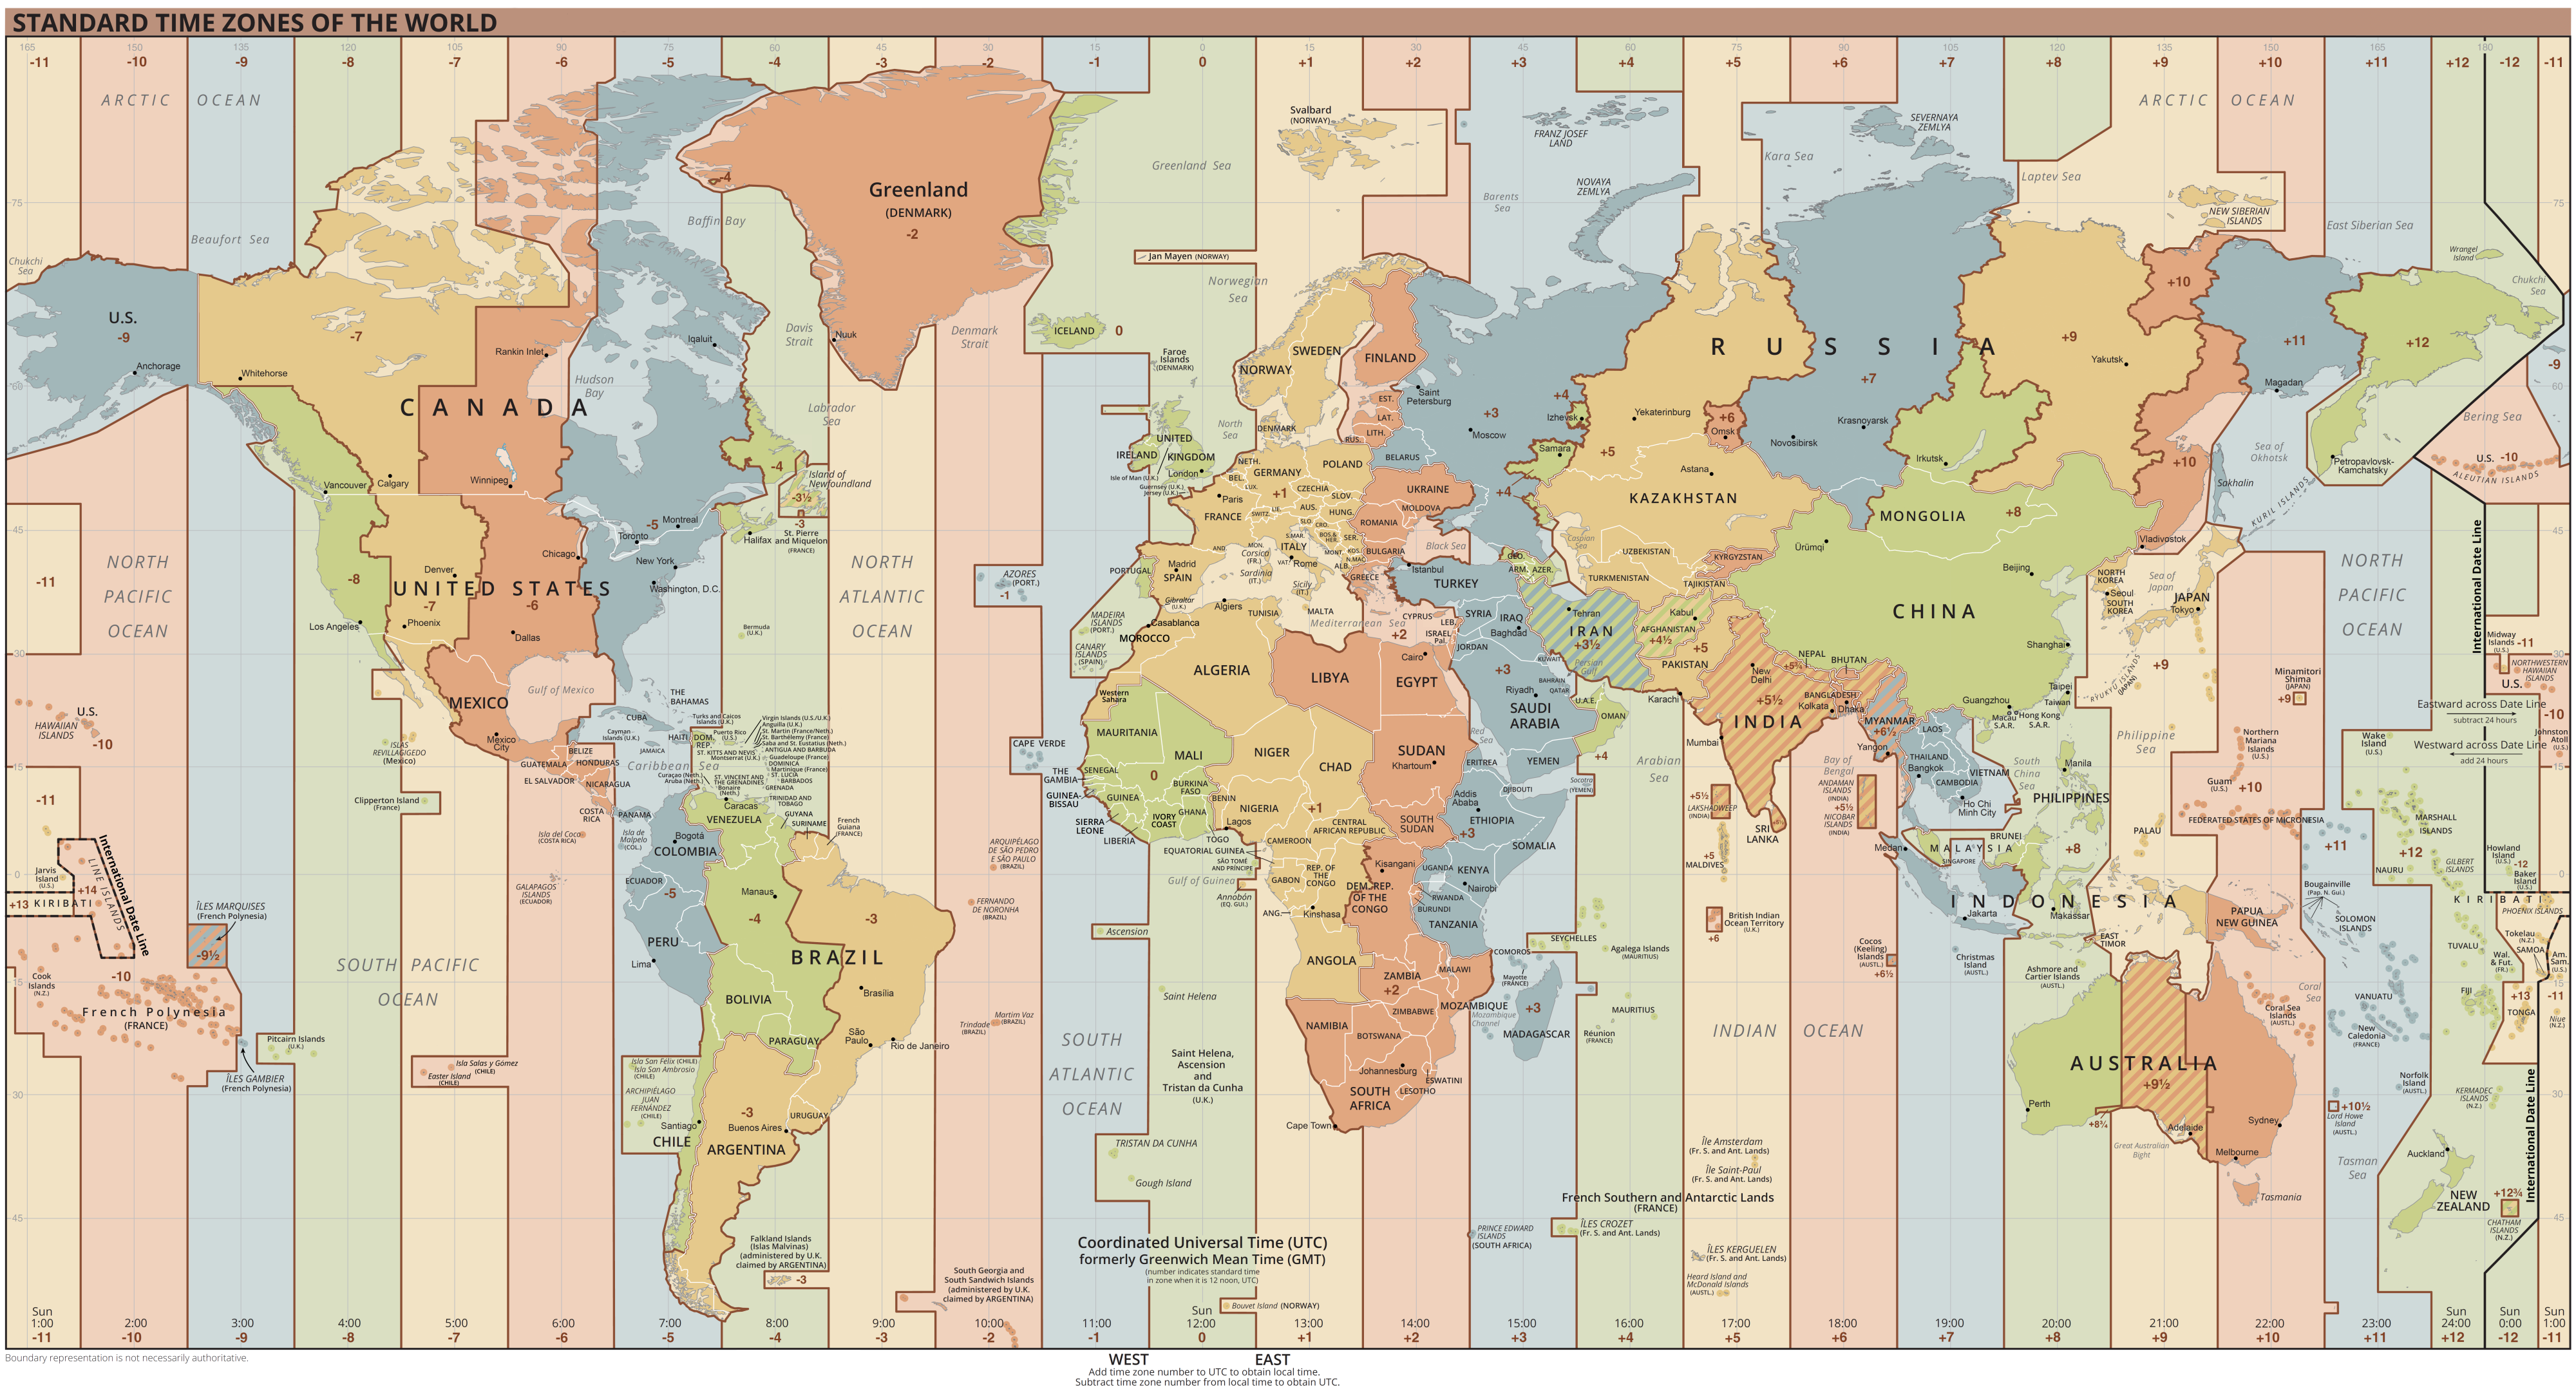
A time zone is a region of the globe that observes a uniform standard time for legal, commercial, and social purpose. As the map shows, the time zones tend to follow the boundaries of the country they cross over in. The time zones on the map look so crazy because they work for the convenience of areas in close commercial communication to keep the same time in the same general area. With the system of time zones we have the concept of adjusting the boundaries to the location does make sense. For example, somewhere in the world the original time zone division probably cut through a city. This would not work because all of the subways would be on different times, confusing most of the city. You would have to know the exact time in each location in every part of the city. This would be highly inconvenient. Since time zones have no rules on them countries were free to change and adjust them, so they did. Overall, time zones are confusing but important to learn about.
Subscribe to:
Comments (Atom)